Binary options allow traders to make time-bound bets on predefined values of assets, including stocks, indices, and forex. Each binary option, like any other exchange-traded option, has an option premium, a predetermined strike price, and an expiry date. The differentiator is usually the settlement price, which depends on the option condition being fulfilled.
To make a trade, you usually study the binary charts of the underlying assets to understand the market trends and then place your bet according to your predictions.
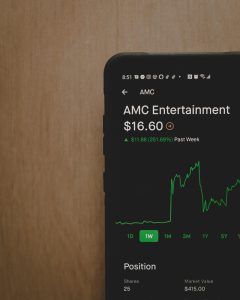
How to Predict the Upcoming Trends
Since binary options are time-bound and condition-based, it all narrows down to the probability. When trading with binary options, your skills in probability calculation matter the most. The factors that help determine probability include
- Volatility – how much? Is it sufficient to cross the strike price?
- Price Direction – will it go beyond the barricade? Or will it go lower?
- Timing – Will the price reach the limit within the set timeframe? Or no?
Most binary trading technical indicators use the above-mentioned factors to show how the next trend is likely to go. You can also make a prediction by looking at patterns of trend reversals and noticing when momentum is still going strong.
Technical Indicators
A technical indicator is a mathematical calculation based on historical prices, volume, or open interest information that intends to forecast future financial market direction. Technical indicators are a fundamental element of technical analysis and are typically plotted as chart patterns to predict future market trends.

A few of the indicators used to predict the market in binary options trading are as follows:
Wilder’s DMI (ADX)
Wilder’s DMI consists of three lines, ADX, DI-, and DI+. The positions of these lines aim to capture the strength of the specific trend. Using Wilder’s DMI, traders can predict the future of binary options trading in accordance with the concerned trend or momentum. By taking aid from this indicator, the client decides whether they should buy or sell their stake.
Pivot Point
Pivot point analysis typically helps determine the trend and direction of the underlying asset in a predetermined time frame. The pivot point is the optimum indicator for assets high in liquidity due to their flexible nature concerning time.
Commodity Channel Index (CCI)
The commodity channel index is used for calculating the current price level of a security relative to the average price over a predetermined time frame. The time frame can be set in accordance with the trader’s preference. This allows traders to have flexibility with the expiry of a binary options trade. The CCI is also significantly helpful when you need to identify new trends and extreme conditions concerning overbought or oversold securities.
The Commodity Channel Index is typically used by day traders for short-term trading and is often paired with additional indicators like oscillators.
Stochastic Oscillator
The Stochastic Oscillator follows the speed and momentum of price. The momentum usually changes direction before the price, indicating extreme overbuying and overselling. This introduces reversals for bullish and bearish phases. The standard period is 14 days, but binary options traders have the liberty to set their own timeframes.
Bollinger Bands
Bollinger Bands are significantly useful when inspecting volatility. They usually identify the upper and lower levels dynamically through recent price fluctuations. The contraction and expansion of the bands indicate reversal signs that help traders opt for the appropriate positions when using binary options. When the market price is above the top brand, the asset is indicated as overbought. Whereas, when the market price is lower than the lower band, the asset is tagged as oversold.
Binary Options that Allow You to Predict
High/Low
This is also referred to as the up/down binary option. It is also one of the most commonly used among binary options traders. In this case, traders predict whether the price of an asset will increase or decrease as compared to the chosen target price within a certain timeframe.
If you predict that the price will go up, you opt for the call option. Whereas, if you predict a drop in the market, you would go for the put option. Expiry times are less than five minutes.
Above/Below
This type is also often termed as higher/lower. Traders with no previous experience or expertise often get confused between this option and the high/low option. However, unlike the high/low option, the above/below does not concern the price of the asset. In this option, you set a barrier with the vision that the instrument value of the asset will be either high or low at the expiration time.
In this case, when you predict that the asset price will be higher than the set barrier price, you buy a call; if you predict that the price will go lower, you choose to put.
Touch/No-Touch
This particular option is similar to the higher/lower option. In this type of trading, you again have to again set a barrier. In this trading, the price fluctuations decide whether you win or lose the trade.
When you choose “Touch” and the asset price goes higher or equals the barrier, you get yourself a profit. Whereas, if it doesn’t reach or exceed the barrier, you lose your capital.
A no-touch option also works similarly but in reverse. If you buy a no-touch option and the price never hits the barrier, you receive your profit.
Conclusion
To predict future financial market trends, the above-stated technical indicators like Wilder’s DMI, Pivot Points, the CCI, the Stochastic Oscillator, and Bollinger Bands play a vital role. When trading with binary options, these can be extremely useful. However, they have their own set of advantages and disadvantages, so each step should be taken cautiously.


