Have you recently become a trader? Well, the ultimate objective of any investor or trader is to buy and sell stocks at a profit. In order to achieve this, traders need to recognize patterns and assess available data to make informed decisions.
The visualization of stock market data is tricky, given the millions of data points and information sources. The best way to handle such information overload is by using stock charting software. It simplifies the process of data collection and analysis, which further eliminates the risk of making emotionally-based decisions.
Get familiar with the basics of such programs.
What is it?
Stock charting software is basically a tool for visualizing stock market data, analyzing trends, and spotting emergency patterns. Trades are assisted with technical analysis while attempting to make predictions on real-time and historical data. This software type provides investors with the current and historical performance of publicly listed companies, live updates on trading volumes and stock price, and investment recommendations. Read here about the size, history, and importance of the stock market.
In general, the primary goal of stock charting software is to support investors and traders in making wiser decisions. These programs are used by anyone purchasing and selling stocks, including individuals making long-term investments, day traders trying to make a short-term profit, stockbrokers working on behalf of customers, etc. If such software offers relevant and accurate data, people whose investments and jobs depend on it will find it useful.
Reasons to use such charting tools
Traders stand to benefit a lot from using stock charting tools, regardless of their experience. They are limited in their capacity to collect and process extensive data volumes. Fortunately, stock charting tools are beneficial in simplifying pattern recognition and speeding up the decision-making process. An important benefit of using such tools is the clear visualization of past trends.
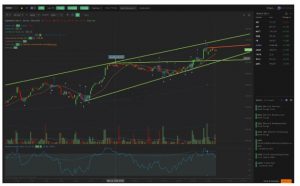
Charts represent a myriad of data points, which have to be mapped onto a visual for individuals to make sense of them. Technical analysis is all about making reviews of past trends to make more informative future investments. Software programs present data in an incredibly visual manner, which makes it easier for traders to evaluate historical performance and identify new developments.
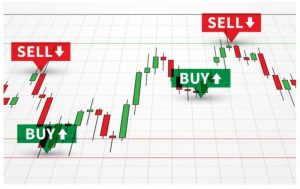
Spotting patterns is another reason for investors to start using these tools. Depending on the program you use, help is available in the shape of idea generation, pattern recognition, and making buying and selling decisions. By investing in the best charting tools, traders can study the behavior of currency pairs, particular stocks, and commodities. Most of them enable users to set up custom triggers in accordance with their preferences.
Consequently, the charting software alerts users when trades are advisable for them to react properly. Another reason why these tools are useful is the easiness of comparing similar stocks to find the ones that suit you the best. By using a charting solution, you can compare stocks side-by-side to figure out the pros and cons of investing in each. A data-based comparison is of the utmost importance in picking the ideal investment.
Probably the greatest benefit of investing in charting software is receiving a response in real-time. Most high-end programs provide users with real-time data on the market, which is of invaluable assistance to day traders making multiple transactions in a single day. Even if your momentary focus isn’t placed on short-term investments, getting up-to-date information will help you keep track of new developments when making long-term decisions.
As mentioned previously, charting software facilitates the process of making objective decisions. Human nature is prone to having biases or emotional reactions. It often happens for traders to react emotionally to market changes that are unpredictable. Technical analysis, however, eliminates the subjective factors and only presents cold facts like patterns and trends. You can base your decisions on calculated risk, not momentary reactions.
What to look for in such software?
The selection of stock charting software programs is extensive, which emphasizes the need for market research. The first decision to make is related to the choice of features. For instance, APIs help integrate stock data into your dashboard. Another feature is live alerts that get triggered based on preset patterns and rules. Follow this URL, https://www.howtogeek.com/343877/what-is-an-api/, to see what an API is and how developers use it.
In addition, there are trade-on chart capabilities that help users make trades directly from the tool. Some programs offer intelligent pattern recognition that contributes to making better decisions. Only by determining the features important to your business can you narrow your search down. Ease of use is another feature to look for, which reduces complexity. It’s important for the learning curve of the program not to be overly steep.
Moreover, the program is expected be easy to set up and use. The installation process should be simple, whereas the program should be versatile and work in any browser. Live data is another factor to consider when choosing features. If you aren’t sure whether you need it, make sure you provide an answer to the following questions:
- Is the program supposed to offer real-time data?
- Are you comfortable with some sort of delay?
- What types of time increments can be viewed within the tool?
If live data isn’t of great importance to you, find a tool that focuses on historical trends.
Customizability is another feature to consider when purchasing stock charting software. Most tools provide users with the necessary charts and standard views. Nevertheless, individuals interested in designing their own dashboards and overviews should look for a program that lets them customize the alerts, level of detail, and views.
Mobile-friendliness is important to users who find on-the-go access indispensable. Tools with such a feature provide a smartphone application. The least your tool should have is a responsive design that corresponds to every screen size.
To sum up
The investment in such software is of great importance for data visualization.
Make smarter decisions to earn higher profits and be the best in the industry!


